Your app writes a job. Postgres records it. Redis schedules it. When Redis goes down — and it will — Postgres still has everything. No lost jobs. No silent failures.
go get github.com/codetesla51/kyu
Call Start(). Three goroutines spin up and stay running. They don't talk to each other — they talk to Postgres and Redis. That's the entire coordination layer.
Pops a job ID from Redis. Fetches the full record from Postgres. Runs your handler. Writes the result back. If it fails and retries remain, it goes back in the queue with a longer wait. If retries are exhausted, it's marked dead and stays in Postgres forever — queryable, not silently dropped.
Wakes every 5 seconds. Asks Postgres which scheduled jobs are due. Pushes their IDs into Redis. Postgres owns the schedule. Redis just gets told when to run things.
Wakes every 60 seconds. Finds jobs stuck in running longer than their timeout — usually because the worker that claimed them crashed. Resets them to pending. You don't have to think about this.
Every time a job changes state, Postgres gets a write. pending, running, failed, dead — all of it is in your database, in a normal table, queryable with normal SQL. No vendor API. No dashboard you have to pay for. Just SELECT.
| Column | Type | Description |
|---|---|---|
| id | STRING | Unique job identifier |
| job_type | STRING | Registered handler name, used to find the handler |
| priority | INT | Higher = processed first. Default 0 |
| created_at | TIME | When the job was created |
| updated_at | TIME | When the job record was last updated |
| deleted_at | TIME | Soft delete timestamp. Null if not deleted |
| payload | STRING | JSON string passed to the handler |
| status | STRING | pending / running / failed / completed / dead / cancelled |
| completed_at | TIME | When the job finished. Null if not completed |
| scheduled_at | TIME | When to run the job. Null means run immediately |
| max_retries | INT | Maximum number of retry attempts allowed |
| retry_count | INT | How many times this job has been retried |
| error_message | STRING | Last error returned by the handler |
| locked_at | TIME | When a worker claimed this job |
| locked_by | STRING | ID of the worker that claimed this job |
Normal Postgres table. Query it however you want. No proprietary API required.
middleware
Redis is a cache. Postgres is a database. Kyu treats them accordingly. Clear Redis entirely — your jobs are still there.
First retry waits 1s. Second waits 2s. Third waits 4s. Your downstream service gets a chance to recover instead of getting hammered by a retry loop.
Pass a Priority value at enqueue time. Higher score runs first. Redis sorted sets handle the ordering — O(log N) inserts, no scanning.
Pass a *time.Time to ScheduledAt. nil means run immediately. The Scheduler picks it up when the time comes. No separate cron process needed.
A worker claims a job then the process dies. Without a reaper, that job is stuck in running forever. Kyu resets it automatically based on StaleJobTimeout.
Register middleware once. Every job runs through it in order — in on the way down, out on the way back. Panics in handlers are caught, not propagated.
/metrics is live the moment you set MetricsPort. Drop in the included docker-compose.yml and Grafana is reading it. Each Kyu instance gets its own registry — run multiple instances, no metric collisions.
Set RunOnce: true. Kyu drains the queue and exits with code 0. Wire it to a Kubernetes CronJob or a plain crontab. No long-running process needed for batch workloads.
Set MetricsPort in your config. /metrics comes up automatically. The repo includes a docker-compose.yml that runs Postgres, Redis, Prometheus, and Grafana together. One command, full observability stack.
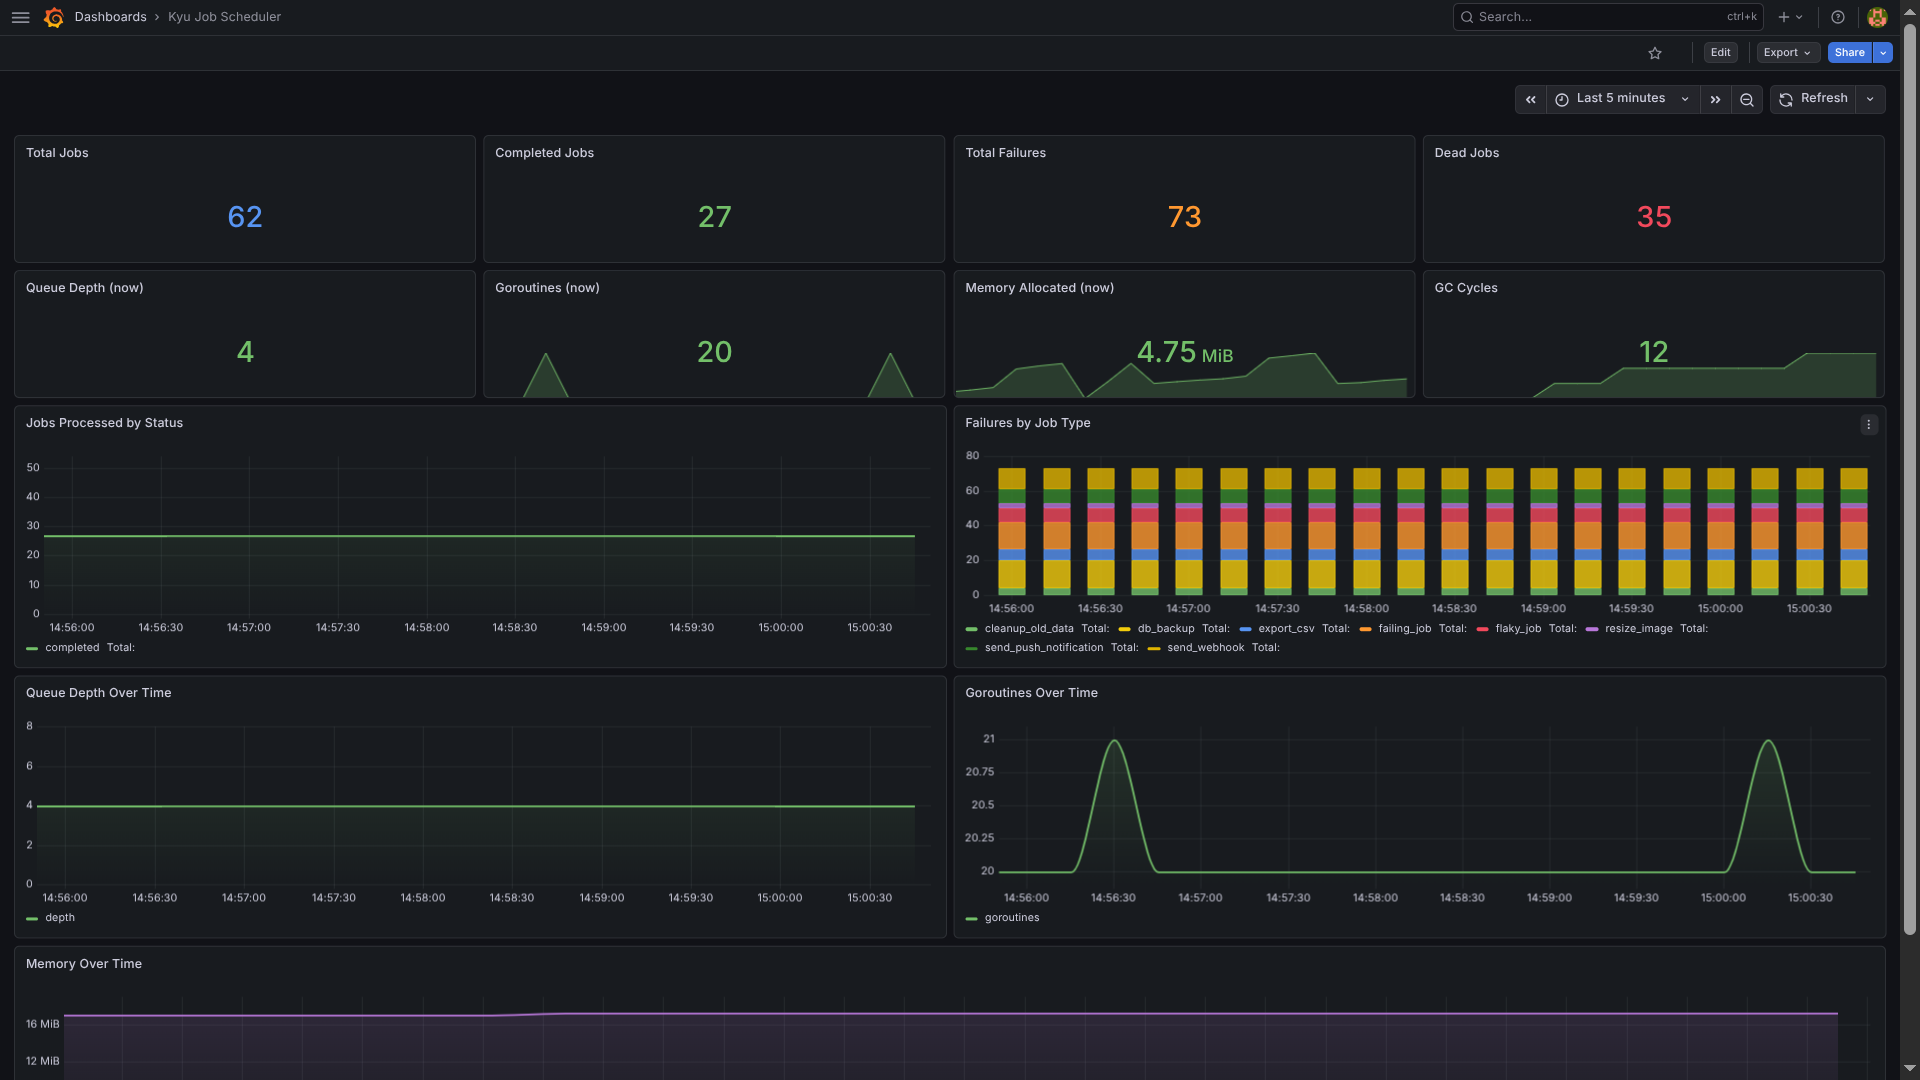
| Metric | Type | Description |
|---|---|---|
| kyu_jobs_total | counter | Total jobs ever submitted |
| kyu_jobs_processed_total | counter_vec | Completed jobs, labelled by status |
| kyu_job_failures_total | counter_vec | Failures, labelled by job_type |
| kyu_jobs_dead_total | counter | Jobs that exhausted all retries |
| kyu_queue_depth | gauge | Jobs currently waiting in Redis |
These numbers measure dispatch overhead only. In practice your bottleneck is the Postgres write and the Redis round-trip — which is fine, because that's where the durability comes from.
Asynq is fast. It's also Redis-only, which means your job history lives in a key-value store with TTLs. River puts everything in Postgres — durable, but no sorted set for priority dispatch. Kyu doesn't pick one. Postgres is the ledger. Redis is the dispatcher. You get the durability of a relational database and the scheduling performance of a sorted set.
| Feature | Kyu | Asynq | River | Machinery | BullMQ (Node.js) |
|---|---|---|---|---|---|
| Language | Go | Go | Go | Go | Node.js |
| Storage backend | PostgreSQL + Redis | Redis only | PostgreSQL only | Redis / AMQP / MongoDB | Redis only |
| Priority scheduling | Redis sorted set | Redis sorted set | Weighted queues | Basic | Redis sorted set |
| Job durability | Survives Redis restart | Lost if Redis clears | Full durability | Depends on backend | Lost if Redis clears |
| Transactional enqueue | Yes | No | Yes | No | No |
| Full job history | Yes (SQL) | Limited (Redis TTL) | Yes (SQL) | Limited | Limited (Redis TTL) |
| Stale job reaper | Yes | Limited | Yes | No | Limited |
| Prometheus native | Yes | Separate | No | No | Separate |
| Scheduled jobs | Yes | Yes | Yes | Yes | Yes |
| Middleware system | Yes | Yes | No | Yes | Yes |
| Retries + backoff | Exponential | Exponential | Exponential | Basic | Exponential |
| Open source | MIT | MIT | MIT | MIT | MIT |
These numbers measure dispatch overhead only. In practice your bottleneck is the Postgres write and the Redis round-trip — which is fine, because that's where the durability comes from.
All fields have defaults. kyu.New(kyu.Config{}) connects to local Postgres and Redis with 5 workers. If you're running multiple apps against the same Redis instance, set a unique QueueName per app — workers compete for any job in their queue.
| Field | Type | Default | Description |
|---|---|---|---|
| DSN | STRING | localhost:5432 | Postgres connection string |
| RedisAddr | STRING | localhost:6379 | Redis address |
| Workers | INT | 5 | Number of concurrent goroutines processing jobs |
| QueueName | STRING | kyu:default | Redis sorted set key. Use different names to isolate queues between apps |
| MetricsPort | INT | 0 (disabled) | Port for Prometheus /metrics endpoint. Set to 0 to disable |
| StaleJobTimeout | DURATION | 10m | Jobs stuck in running beyond this are reset to pending. Handles crashed workers |
| MaxOpenConns | INT | 25 | Postgres connection pool max open connections |
| MaxIdleConns | INT | 25 | Postgres connection pool max idle connections |
| ConnMaxLifetime | DURATION | 5m | Postgres connection max lifetime |
| Logger | *log.Logger | log.Default() | Logger instance |
| RunOnce | BOOL | false | Drain the queue and exit instead of running a persistent loop |
Every job is a row in Postgres. You can query it with normal SQL, or use the built-in methods. Dead jobs stay in the table forever — queryable, not silently dropped.
CancelJob works on pending, scheduled, and failed jobs. It has no effect once a job is running — the worker already holds the lock.
A docker-compose.yml is included. It starts Postgres, Redis, Prometheus, and Grafana together. A pre-built dashboard covers queue depth, job throughput, failure rates by job type, goroutine count, and memory usage.
docker compose up --build| Service | Address |
|---|---|
| Metrics | localhost:9090 |
| Prometheus | localhost:9090 |
| Grafana | localhost:3000 |
| Postgres | localhost:5432 |
| Redis | localhost:6380 |
go test -short ./...go test ./...go test -bench=. -benchmem -count=3Integration tests require Postgres on 5432 and Redis on 6380. Update the DSN and Redis address in kyu_integration_test.go to match your local setup before running.